How It Works
Understand when and how to use each statistical test in Indexly.
How the Inference Engine Works
The dispatcher routes your request based on --test.
Each test:
- Has defined input requirements
- Applies correct statistical assumptions
- Returns structured output
- Can auto-reroute if assumptions fail
Test Selection Guide
Correlation Tests
| Test | When to Use | Command Example |
|---|---|---|
correlation |
Linear relationship between two continuous variables | --test correlation --x height weight |
corr-spearman |
Monotonic relationship (non-normal data) | --test corr-spearman --x rank score |
corr-lag |
Time-shifted correlation | --test corr-lag --x sales revenue |
corr-matrix |
Multiple variable correlation overview | --test corr-matrix --x col1 col2 col3 |
Pearson CI uses Fisher Z-transform.
Example:
indexly infer-csv health.csv --test correlation --x cholesterol --y age --use-raw
T-Tests
| Test | When to Use | Required Arguments |
|---|---|---|
ttest |
Compare two independent groups | --y outcome --group category |
paired-ttest |
Same subjects measured twice | --x before after |
Example:
indexly infer-csv trial.csv --test ttest --y blood_pressure --group treatment
ANOVA
| Test | Purpose |
|---|---|
anova |
Compare means across 3+ groups |
anova-posthoc |
Tukey HSD pairwise comparisons |
Supports:
- Assumption checks
- Optional correction (
--correction bonferroni) - Auto rerouting
Example:
indexly infer-csv study.csv --test anova --y score --group group_name
Nonparametric Tests
| Test | Alternative To |
|---|---|
mannwhitney |
Independent t-test |
kruskal |
ANOVA |
Use when:
- Data not normal
- Small sample size
- Ordinal variables
Regression
| Test | Description |
|---|---|
ols |
Ordinary Least Squares regression |
mixed |
Mixed-effects model |
Supports:
- Interaction terms
- Bootstrap coefficients
- Assumption validation
Example:
indexly infer-csv dataset.csv --test ols --y outcome --x age income --interaction age income
Confidence Intervals
| Test | Description |
|---|---|
ci-mean |
CI for single mean (t-distribution) |
ci-proportion |
CI for binomial proportion |
ci-diff |
CI for mean difference |
Example:
indexly infer-csv survey.csv --test ci-mean --y satisfaction
Advanced Controls
Auto Rerouting
--auto-route
Automatically switches to a nonparametric test if assumptions fail.
Bootstrap
--bootstrap
Uses bootstrap confidence intervals where supported.
Multiple Comparison Correction
--correction bonferroni
--correction holm
--correction bh
Applies correction to post-hoc or ANOVA outputs.
Output Structure
All tests return a unified structure:
- Statistic
- P-value
- Effect size (when applicable)
- Confidence interval
- Interpretation
- Metadata
- Optional additional tables
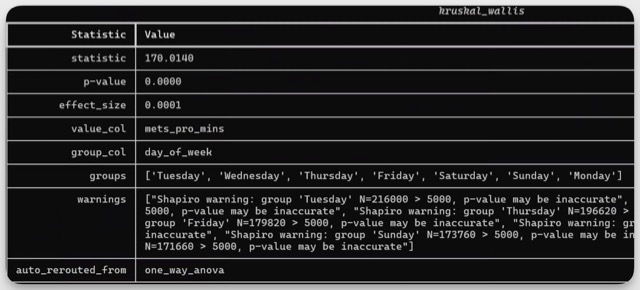
Formatted Inference Output
Summary
The inference engine is:
- Statistically rigorous
- CLI-native
- Assumption-aware
- Modular
- Extensible
You can phrase it like this:
The next section will demonstrate a complete workflow using:
analyze-csvinfer-csv- Report export
If you’d like to understand the statistical concepts behind these commands first, you can review the mathematical foundation section before continuing.